

Useful Gravity Forms analytics starts with five questions: how many people saw the form, how many began it, how many submitted it, where multi-page users dropped out, and which fields produced errors or hesitation. An entry count answers only one of those questions. To improve a form, you need a measurement model that separates exposure, engagement, completion, abandonment, and field friction.
This guide shows how to build that model, choose between local analytics and Google Analytics, and turn the resulting numbers into specific form changes. It focuses on Gravity Forms, but the definitions and diagnostic process apply to most WordPress forms.
The Gravity Forms metrics that matter
Define each metric before comparing forms or reporting a conversion rate. Two tools can display a label such as “views” or “abandonment” while counting very different things.
| Metric | Practical definition | Question it answers |
|---|---|---|
| Sessions | Distinct visits or visitors who had an opportunity to use a specific form | How many real opportunities did this form have? |
| Starts | Sessions with meaningful form interaction | Did visitors begin after seeing the form? |
| Submissions | Successful completed submissions | How many people reached the intended form outcome? |
| Validation errors | Rejected submission attempts or field-level validation failures | Which requirements prevent completion? |
| Abandonments | Started sessions that did not later submit within the tool’s defined window | How often does engagement end without completion? |
| Page progression | Sessions reaching each page of a multi-page form | Which step loses the most people? |
Session conversion rate
submissions ÷ sessions × 100
This is the broad form conversion rate: of everyone who had a real opportunity to use the form, what share completed it? It captures both failure to start and failure to finish.
Started conversion rate
submissions ÷ starts × 100
This isolates the form-filling experience. A strong started conversion rate with a weak session conversion rate points toward the page, offer, form placement, or first impression. A weak started conversion rate points more directly toward fields, steps, errors, or expectations inside the form.
Start rate
starts ÷ sessions × 100
Use this to avoid blaming the form for a page-level problem. A contact form far below the fold may have a low start rate even when people who reach and begin it complete successfully.
Abandonment rate
A common calculation is (starts − submissions) ÷ starts × 100, but use it only when the measurement window and visitor identity rules are clear. A person who starts today and submits tomorrow should not necessarily be counted as permanently abandoned. Save & Continue also creates a different state from silent abandonment; see our Gravity Forms Save & Continue guide when long forms can be resumed.
Do not use raw render counts as unique visitors
A form can render more than once for one person because of reloads, AJAX updates, page-builder behavior, repeated visits, or embedded copies. If the denominator counts renders while the numerator counts completed entries, the displayed conversion rate can fall even though user behavior did not change.
Before trusting a conversion percentage, ask:
- Does a refresh create another view?
- Are administrators and editors included?
- Does the same visitor count again on a later visit?
- Are cached pages handled correctly?
- Does an AJAX re-render count as another opportunity?
- Are spam and test submissions excluded from the numerator?
Keep the raw view number if it is useful for technical diagnostics, but do not silently label it “people” or “sessions.” Stable definitions matter more than an impressive dashboard.
Choose the right analytics layer
Form analytics is not one product category. Submission reporting, traffic attribution, behavioral measurement, and session replay solve different jobs.
| Approach | Best for | Important limitation |
|---|---|---|
| Gravity Forms entries and view counts | Basic volume and completed-entry review | Limited start, abandonment, funnel, and field-friction context |
| Official Gravity Forms Google Analytics Add-On | Connecting submissions and pagination to acquisition, campaigns, audiences, and other site activity in GA4 | Requires GA configuration and does not by itself provide a native field-friction dashboard |
| Local form-behavior analytics | Sessions, starts, abandonment, validation, field behavior, and multi-page funnels inside WordPress | Does not replace GA4 for cross-site marketing attribution |
| Heatmaps and session replay | Seeing layout, scrolling, pointer, and visual interaction patterns | Higher privacy and review burden; sampled recordings can be misleading |
| Charts built from submitted entries | Reporting answers, survey results, sales, and operational data after submission | Cannot explain visitors who never submitted |
Many sites benefit from two layers: GA4 for acquisition and downstream business outcomes, plus local form analytics for the mechanics of starting and completing the form.
Set up Gravity Forms conversion tracking in GA4
The official Gravity Forms Google Analytics Add-On sends submission and pagination events to Google Analytics. It supports Measurement Protocol, Google Analytics, Google Tag Manager, and manual configuration. Choose the simplest connection that meets the reporting requirement; Gravity Forms describes Tag Manager as the advanced option.
1. Decide what a successful event means
A valid submission is not always a lead. A support request, newsletter subscription, account registration, booking, payment, and lead form represent different outcomes. Use one stable event name per meaning and carry the form ID or form purpose as a parameter instead of creating a new naming convention every month.
Google lists generate_lead as the recommended event for a generated lead. It also documents events such as sign_up, subscribe, and book_appointment for their corresponding outcomes. Use the event that matches the user action, not whichever name is most familiar.
2. Avoid installing the Google tag twice
The Gravity Forms add-on can output the Google Analytics or Tag Manager script, but another plugin, theme, or consent platform may already do that. Gravity Forms warns that installing the script more than once can duplicate events. Inspect the existing implementation before enabling another copy.
3. Configure the submission feed
Create a Google Analytics feed for the form, choose the event or trigger settings, and pass only useful parameters. A compact starting set is:
- form ID or stable form key;
- form purpose, such as
sales_leadorsupport_request; - page path or placement;
- lead value and currency only when a defensible business value exists; and
- non-sensitive campaign context.
Never send names, email addresses, phone numbers, message contents, or other personally identifiable form values to GA4 as event names, URLs, or parameters.
4. Configure pagination only when it changes a decision
Page events can reveal a funnel, but more events do not automatically create more insight. Use stable page numbers and, when helpful, a short semantic step label such as contact, requirements, or review. Keep labels synchronized with form changes so historical reports remain interpretable.
5. Test AJAX and non-AJAX behavior
Submit the form through its real public embed. Verify the event once in the browser or tag debugger and again in GA4’s debugging or real-time tools. Test confirmation messages and confirmation redirects separately. If the form has several pages, test forward navigation, validation failure, backward navigation, and final submission.
Then check that one successful action creates one success event. A working report with duplicates is still a broken measurement system.
6. Mark the real business outcome as a key event
In GA4, mark the successful outcome as a key event when it represents an important action. If a lead has a consistent estimated value, Google recommends sending value and the matching three-letter currency. Do not assign arbitrary revenue merely to make the report look more complete.
Measure multi-page form drop-off
A total abandonment rate tells you that people left; a page funnel tells you where the loss accumulated. For a four-page form, record the number of qualified sessions that reach each page and the final submission.
| Step | Sessions reaching step | Progression from previous step |
|---|---|---|
| Page 1: contact | 100 | — |
| Page 2: requirements | 78 | 78% |
| Page 3: budget and timeline | 44 | 56% |
| Page 4: review | 39 | 89% |
| Submitted | 36 | 92% |
This synthetic example does not prove that “budget” is the problem. It identifies Page 2 → Page 3 as the segment to investigate. The cause could be sensitive questions, unclear expectations, a technical error, a weak mobile layout, or simply a high-commitment qualification step doing its intended job.
Before removing the step, compare:
- mobile versus desktop progression;
- new versus returning visitors;
- traffic source and landing page;
- validation errors on the page;
- time spent before exit;
- lead quality after submission; and
- whether the step is required operationally or legally.
A shorter form can produce more submissions and worse leads. Optimize for the business outcome, not completion rate in isolation.
Find field friction without collecting field values
Field analytics should answer how people interact, not expose what they typed. Useful signals include:
- how many started sessions reached or focused a field;
- how long interaction remained on a field;
- how often a field produced validation errors;
- how often an optional field was skipped;
- where the last meaningful interaction occurred before abandonment; and
- which sub-input failed inside compound fields such as Name or Address.
Never record passwords, payment data, health information, message contents, or other field values merely to diagnose friction. You usually need the field identifier, interaction state, timing, error type, device context, and final form outcome—not the visitor’s answer.
Interpret error counts with exposure
A field with 40 errors is not necessarily worse than a field with ten errors. If 10,000 people reached the first field and only 100 reached the last field, the smaller raw count can represent a much higher error rate. Compare errors with the number of sessions or attempts that reached the field.
Separate a difficult question from a broken field
High time on a field can mean confusion, thoughtful consideration, searching for information, accessibility trouble, or an expected complex answer. Combine time, validation, abandonment, and downstream lead quality before deciding what to change.
A worked diagnostic example
Assume a quote form records the following synthetic 30-day results:
- 1,000 sessions;
- 620 starts;
- 248 valid submissions;
- the largest page loss before the budget step;
- a 24% validation-error rate on the phone field; and
- a 5% error rate across the rest of the required fields.
The session conversion rate is 24.8%, the start rate is 62%, and the started conversion rate is 40%. Those numbers suggest two separate opportunities:
- Before the form: 38% of sessions never start. Review placement, page promise, introductory copy, trust information, and whether the form is shown to the right audience.
- Inside the form: 60% of starters do not submit. Review the budget step and phone validation before redesigning every field.
A reasonable first experiment would clarify why the phone number is needed, allow the expected international formats, and ensure the input type and error message work on mobile. Measure the same denominators for a full business cycle. If error rate falls without harming lead quality, keep the change. If not, investigate the next strongest signal.
Turn analytics into an optimization loop
- Choose one business outcome. Define what counts as success and how lead quality will be checked.
- Freeze metric definitions. Record how sessions, starts, submissions, and abandonment are calculated.
- Establish a baseline. Use enough time to include normal weekday, weekend, and campaign variation.
- Select one diagnosed problem. Start with a page, field, validation rule, or pre-form promise—not a full redesign.
- Change one meaningful element. Document the date and affected forms.
- Verify tracking after deployment. Cache, AJAX, consent, and embed changes can break measurement.
- Compare behavior and outcome. Review completion, errors, abandonment, lead quality, and downstream revenue where available.
- Keep, revert, or refine. Record the decision so the same failed idea is not repeated later.
Do not declare a winner after a handful of sessions, and do not treat a correlated change as proof of cause when campaigns, traffic mix, outages, or form placement also changed.
Local Gravity Forms analytics with Form Analytics Pro
Odd Jar makes Form Analytics Pro for Gravity Forms, so this is a commercial recommendation. It is designed for the local diagnostic layer: sessions, starts, conversion, abandonment, field-level behavior, validation errors, multi-page funnels, and real-time activity inside WordPress. It does not replace GA4 when you need campaign attribution, advertising audiences, or a journey spanning the rest of the site.
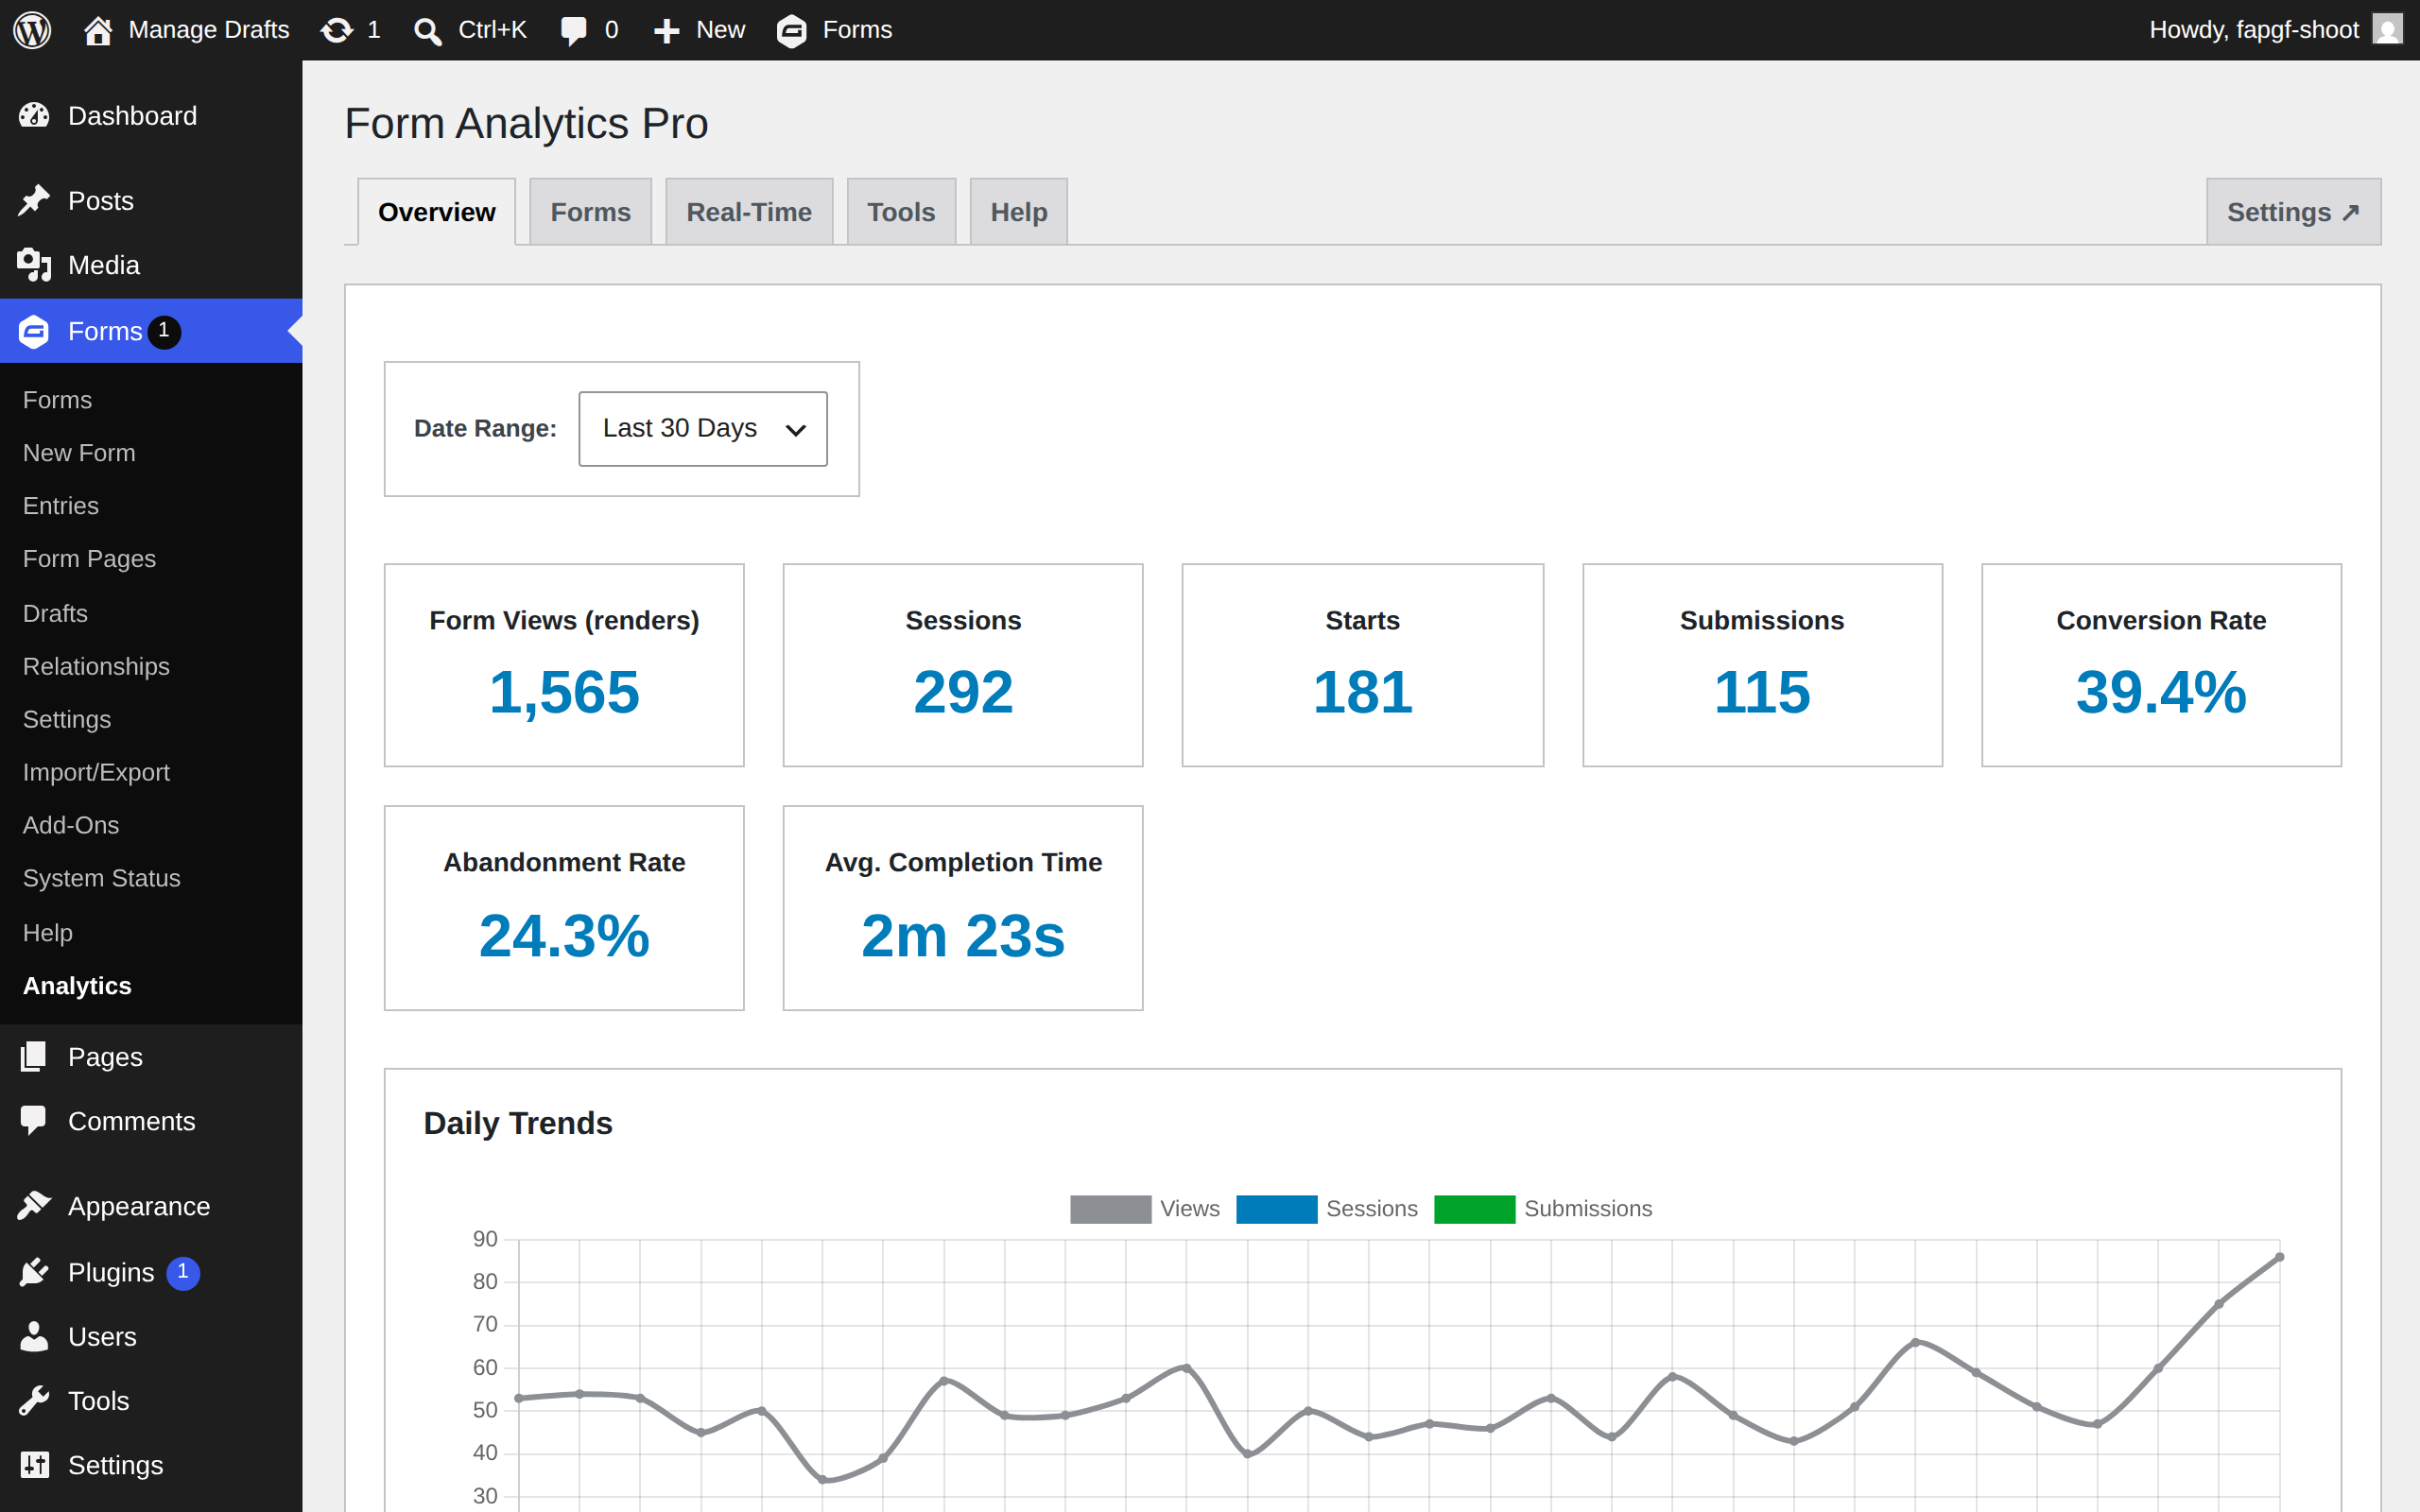
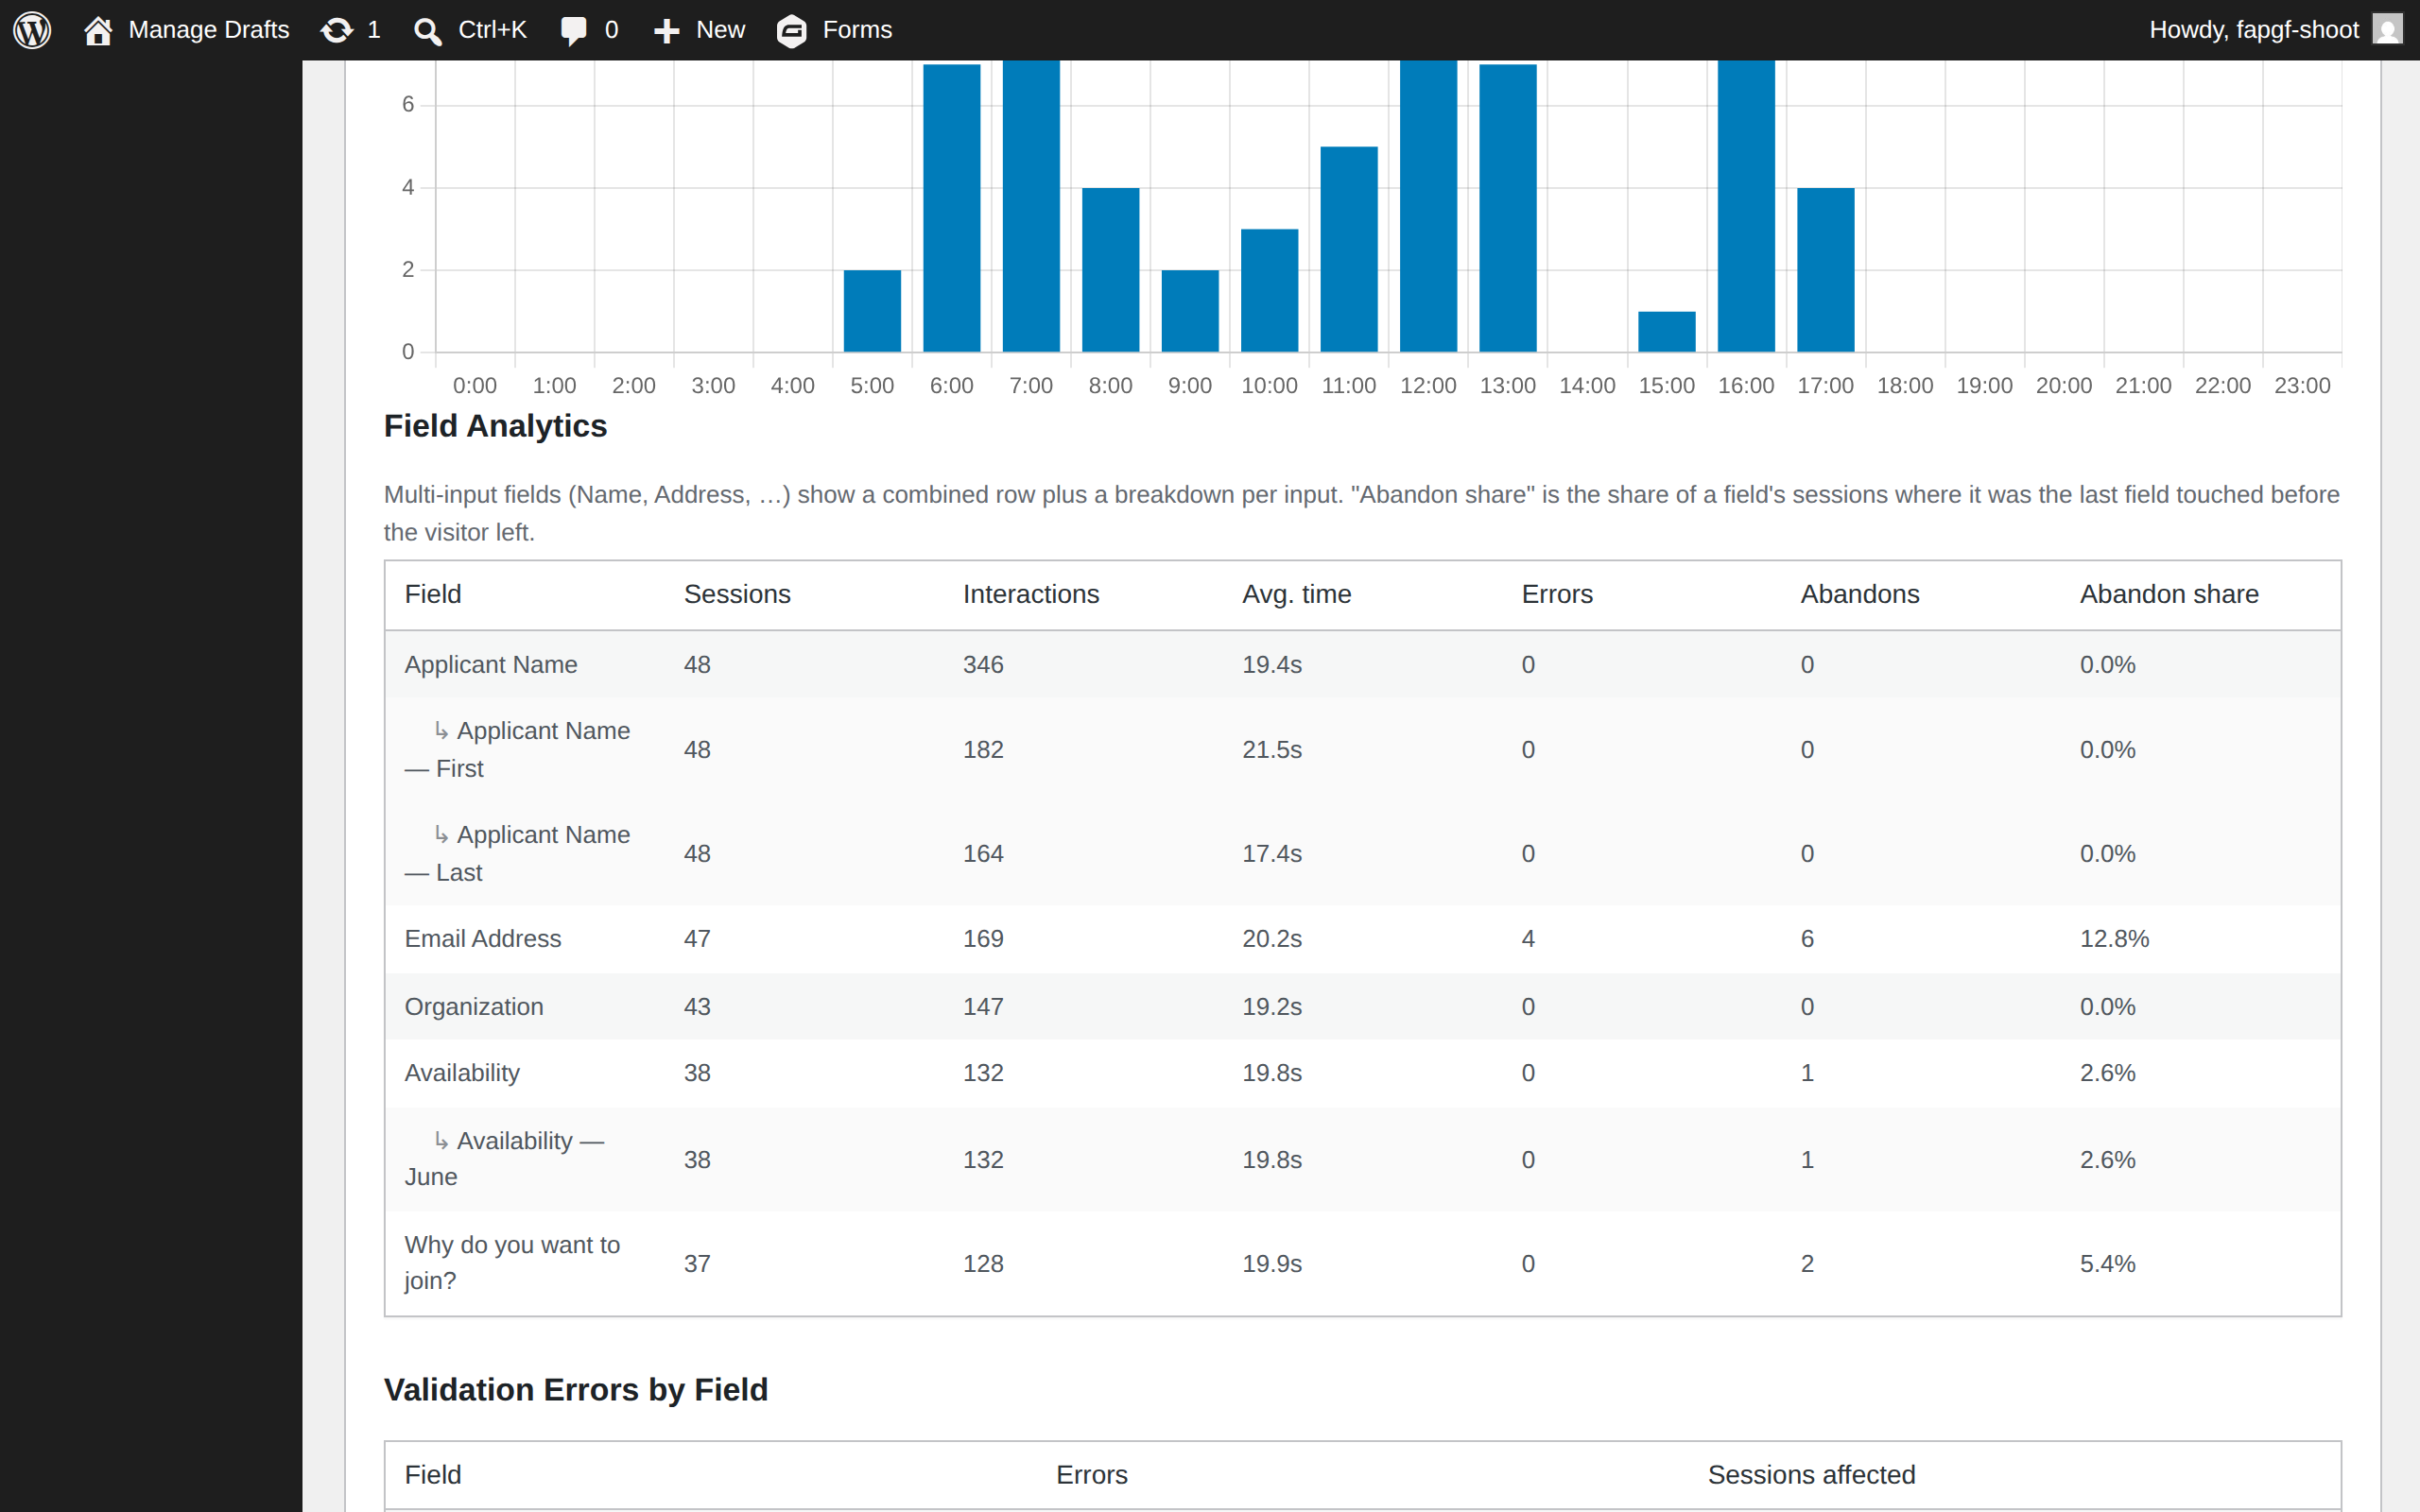
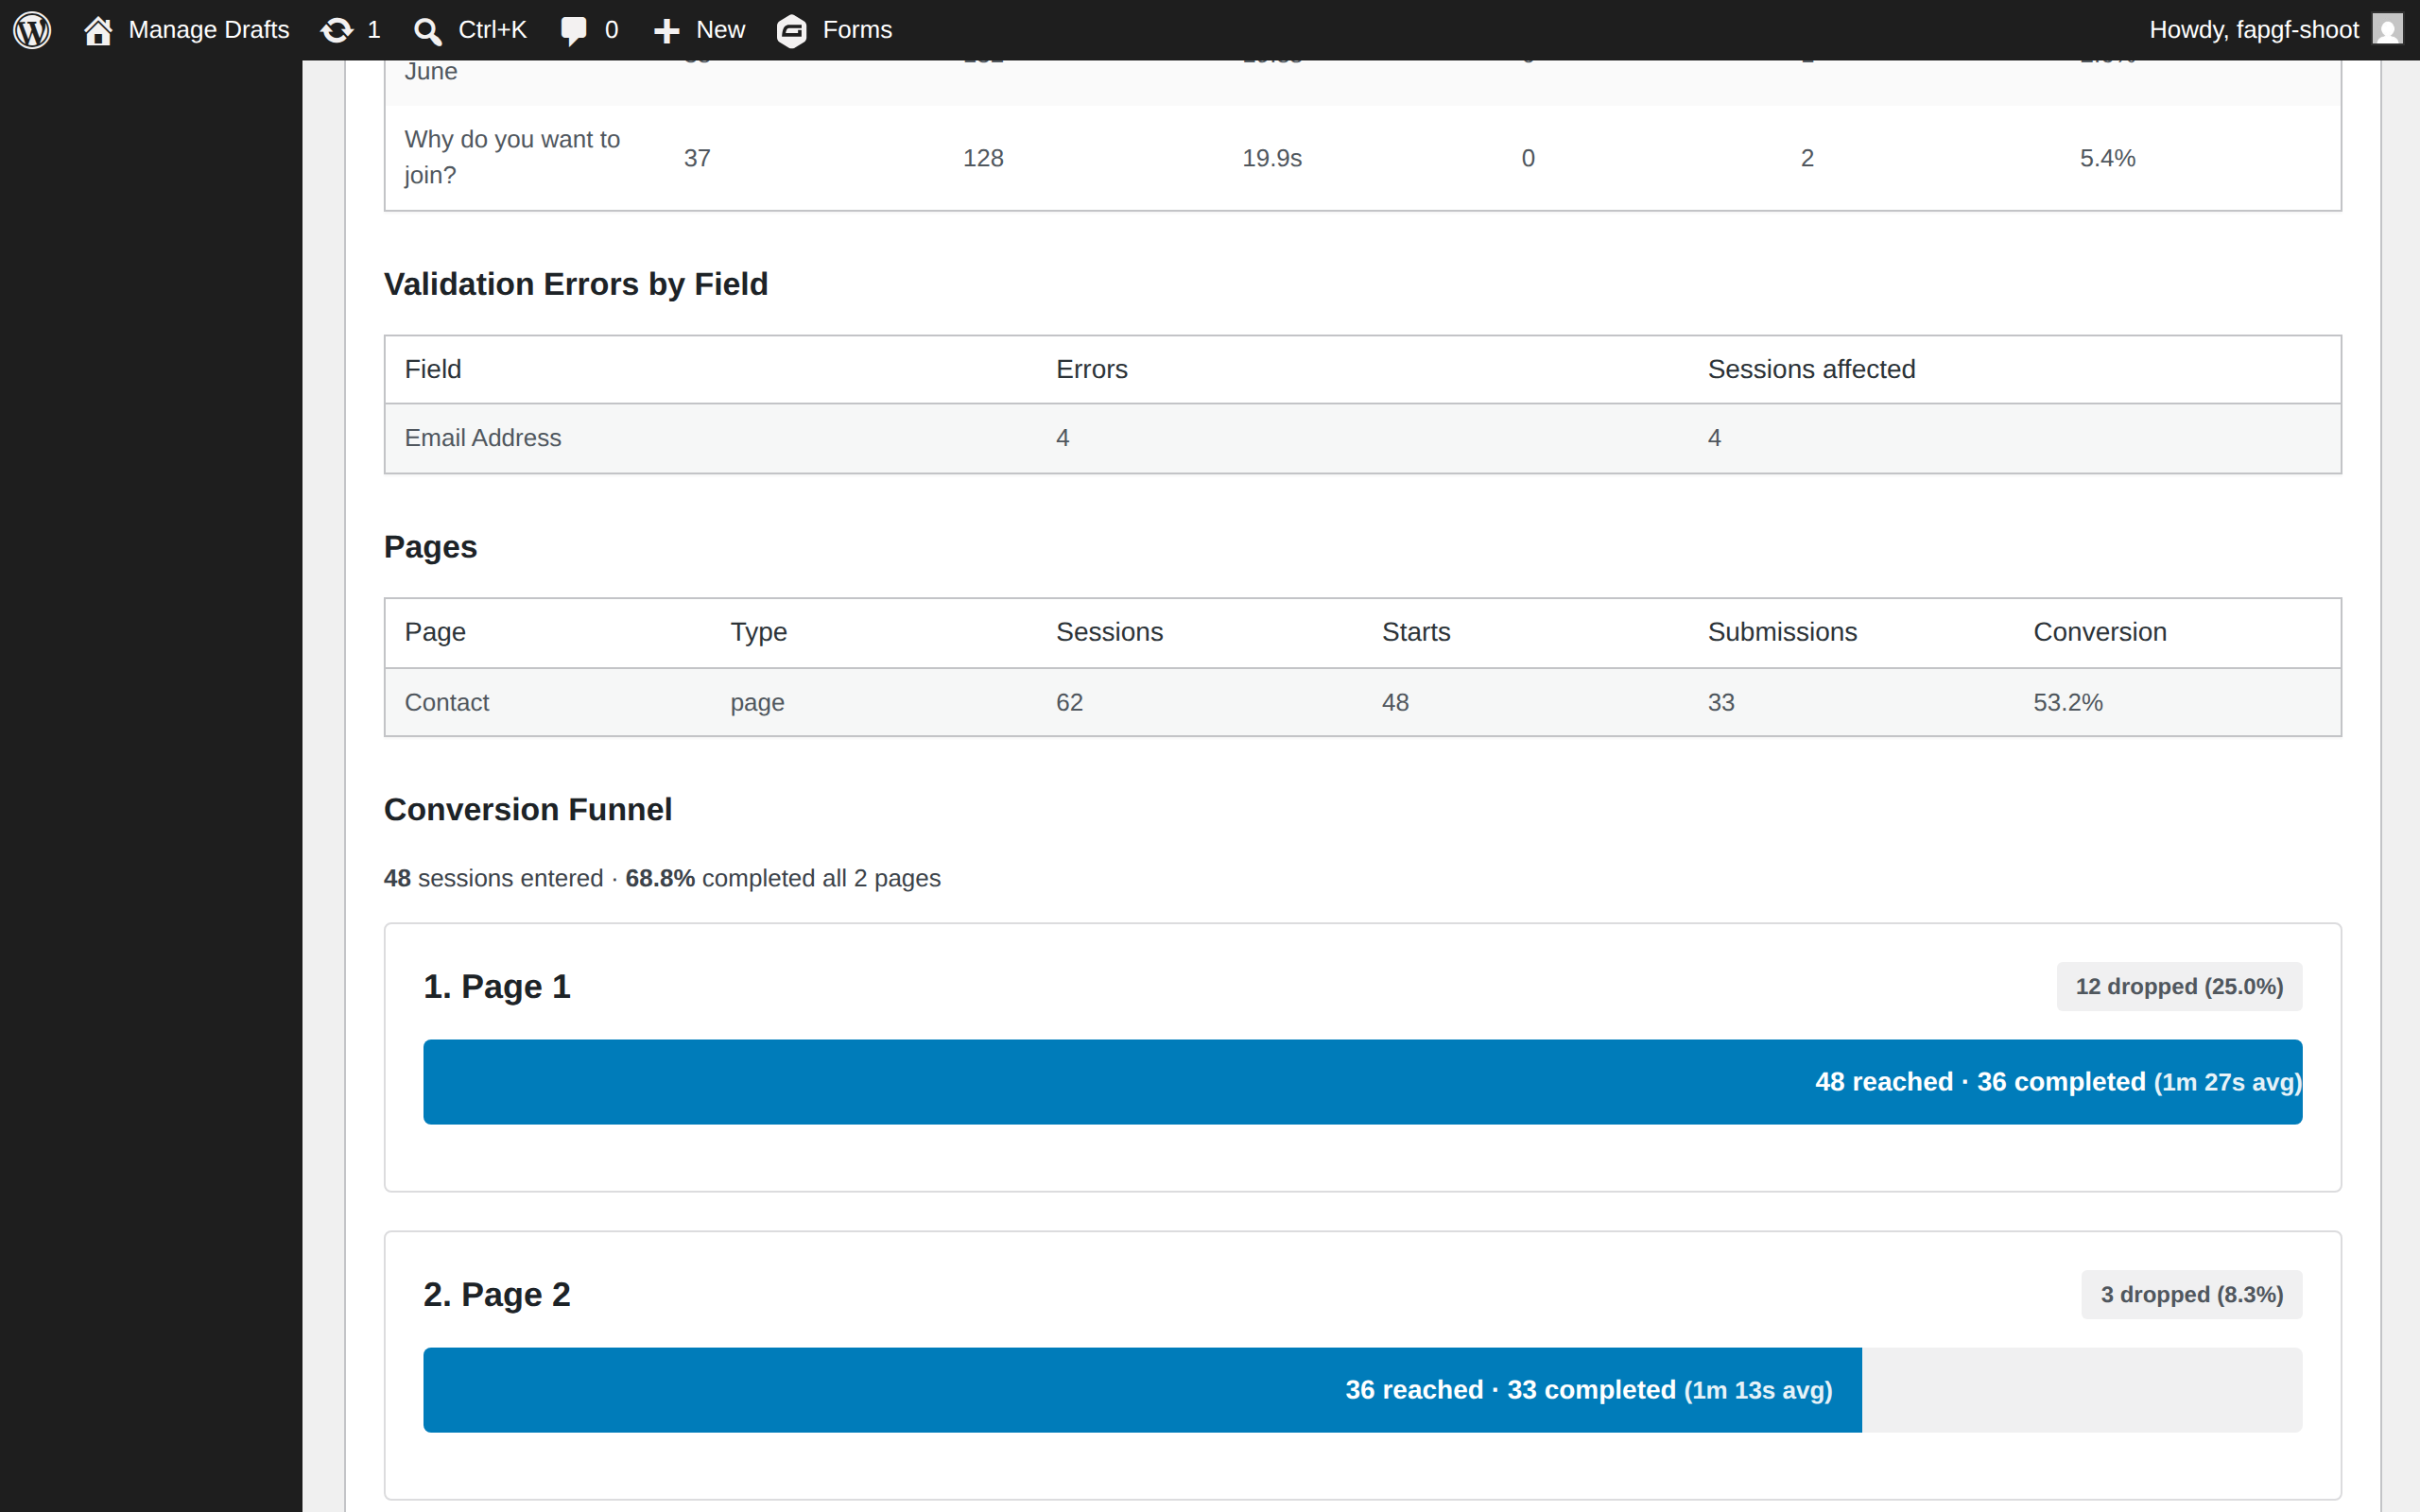
Version 2.0 records server-side validation errors, does not collect field values, anonymizes IP addresses by default, excludes administrators by default, and loads its dependency-free tracker only where a form is present. Earlier-version data remains available as a read-only archive after upgrading; the new session-based format begins fresh. See the Form Analytics Pro 2.0 release notes for that migration detail.
The current licenses are $59 per year for one site, $199 per year for 20 sites, and $299 one time for an unlimited-sites lifetime license.
See Form Analytics Pro features and screenshots →
Build a measurement system you can explain
A credible form report should let you explain the numerator, denominator, visitor identity, time window, exclusions, and success event. Once those definitions are stable, the workflow becomes straightforward: locate the largest meaningful loss, investigate the page or field behind it, change one thing, and measure both completion and business quality.
Start by separating sessions, starts, and submissions on the form that matters most. That single distinction usually tells you whether to improve the page around the form or the experience inside it.

